

(12.04.2021, C. Brauner, R. Rosenboom, C. Kiencke)
The fact that projects do not go as planned is nothing new and is hardly a lead story for an article. However, keeping a project or project portfolio under control remains a daily challenge.
For a long time, the earned value analysis seemed a bit dusty to us and after learning for the project management certification according to PMI it ended up quite far down in our toolbox. When managing projects in the offshore sector, we pulled her out again and she served us very well. Offshore projects are characterized by some special challenges, e.g .:
- Very high, costly resource expenditure
- High logistics costs Very high costs in the event of problems (one screw is missing – must be flown in with a helicopter)
- Challenging communication through changing teams (back-to-back teams)
- Remote teams, i.e. it is difficult to get a personal picture – reporting is only ever done by the site manager
- Very fixed target dates (due to weather windows, crewing offshore)
- Projects with inherently high risks and therefore continuously high potential for controversy between the stakeholders (high risks, e.g. weather, dependence on other teams, etc.)
As part of project controlling, the earned value analysis helped us a lot in mastering these points and thus contributed to turning projects in this area into successful projects. We would like to share these experiences from our team at Arminius Industrial Projects with you and contribute to the general learning curve.
In two parts, this article gives a brief insight into earned value analysis and what information can be derived from it. It also explains how it can provide the project manager with answers to the questions in practice: Where is the project? Are we reaching the milestones? Is the budget enough? Finally, it explains how the analysis can help to overcome some of the challenges mentioned above and what the success factors are for a successful implementation.
The analysis itself is not complicated and quickly explained. The basis of the earned value analysis are the work breakdown structure and the effort planning for each work package. The three basic sizes are:
- Planned Value – the planned costs for the results to be generated by the relevant date
- Actual Cost – the actual costs incurred for the project up to a key date
- Earned Value – includes the results of the project so far and the costs budgeted for them
With the help of the planned figures and actual data, the completion value is calculated, which reflects the progress of the project in terms of costs, time and degree of completion. The progress of the project is viewed on a daily basis, and deadlines and costs are checked. From this we calculate forecasts for the expected end of the project and the expected project costs, which serve as the basis for any control measures. This information can be documented as concrete values in a report and, of course, displayed over time as a graphic.
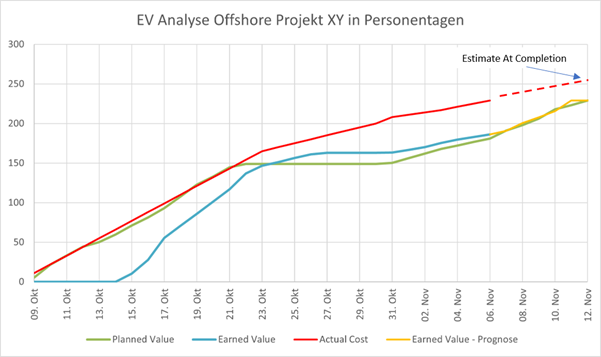
We have shown an example of the progress of a work package from a real project. At the beginning of the project there were severe delays due to a lack of construction space. The delays could be made up through special measures. These led to an increase in costs, which meant that we were ultimately able to keep the completion milestone.
It has proven to be very practicable to derive an Earned Value prognosis in addition to the cost prognosis (Estimate At Completion). In the offshore area, deadlines are sometimes higher than the cost targets. If the database stands for the earned value analysis, other interesting analyzes can be derived from it, e.g. the efficiency of the use of resources.
In addition to the evaluations for the schedule variance (plan deviation; deviation from the planned goals) and the cost variance (the cost variance is measured against the actual actual costs of the project), relative values such as cost and time efficiency can also be determined. These figures are an important indicator of whether the deviations will be compensated for or whether the project is developing further away from plan. These values can also be used to develop forecast values, for example to assess whether the delays are one-off effects or recurring problems that need to be considered further.
In the 2nd part it is explained how the EV method can help to get the aforementioned challenges in offshore projects under control.
Source for the earned value analysis: A Guide to the Project Management Body of Knowledge, Sixth Edition, 2017, Project Management Institute
Photo in Header: AdobeStock, T.W. van Urk
Graphics: Own illustration